5.2 Lonely by whose standard
The studies of interest24 here are Wee et al. (2019), Ge et al. (2017), Lim and Chan (2017), and Chan et al. (2015). All of these studies use a variant of the 3-item UCLA25 Loneliness Scale (Hughes et al. 2004). The 3-item UCLA Loneliness Scale consists of three questions, which all of these studies use:
- How often do you feel you lack companionship?
- How often do you feel left out?
- How often do you feel isolated from others?
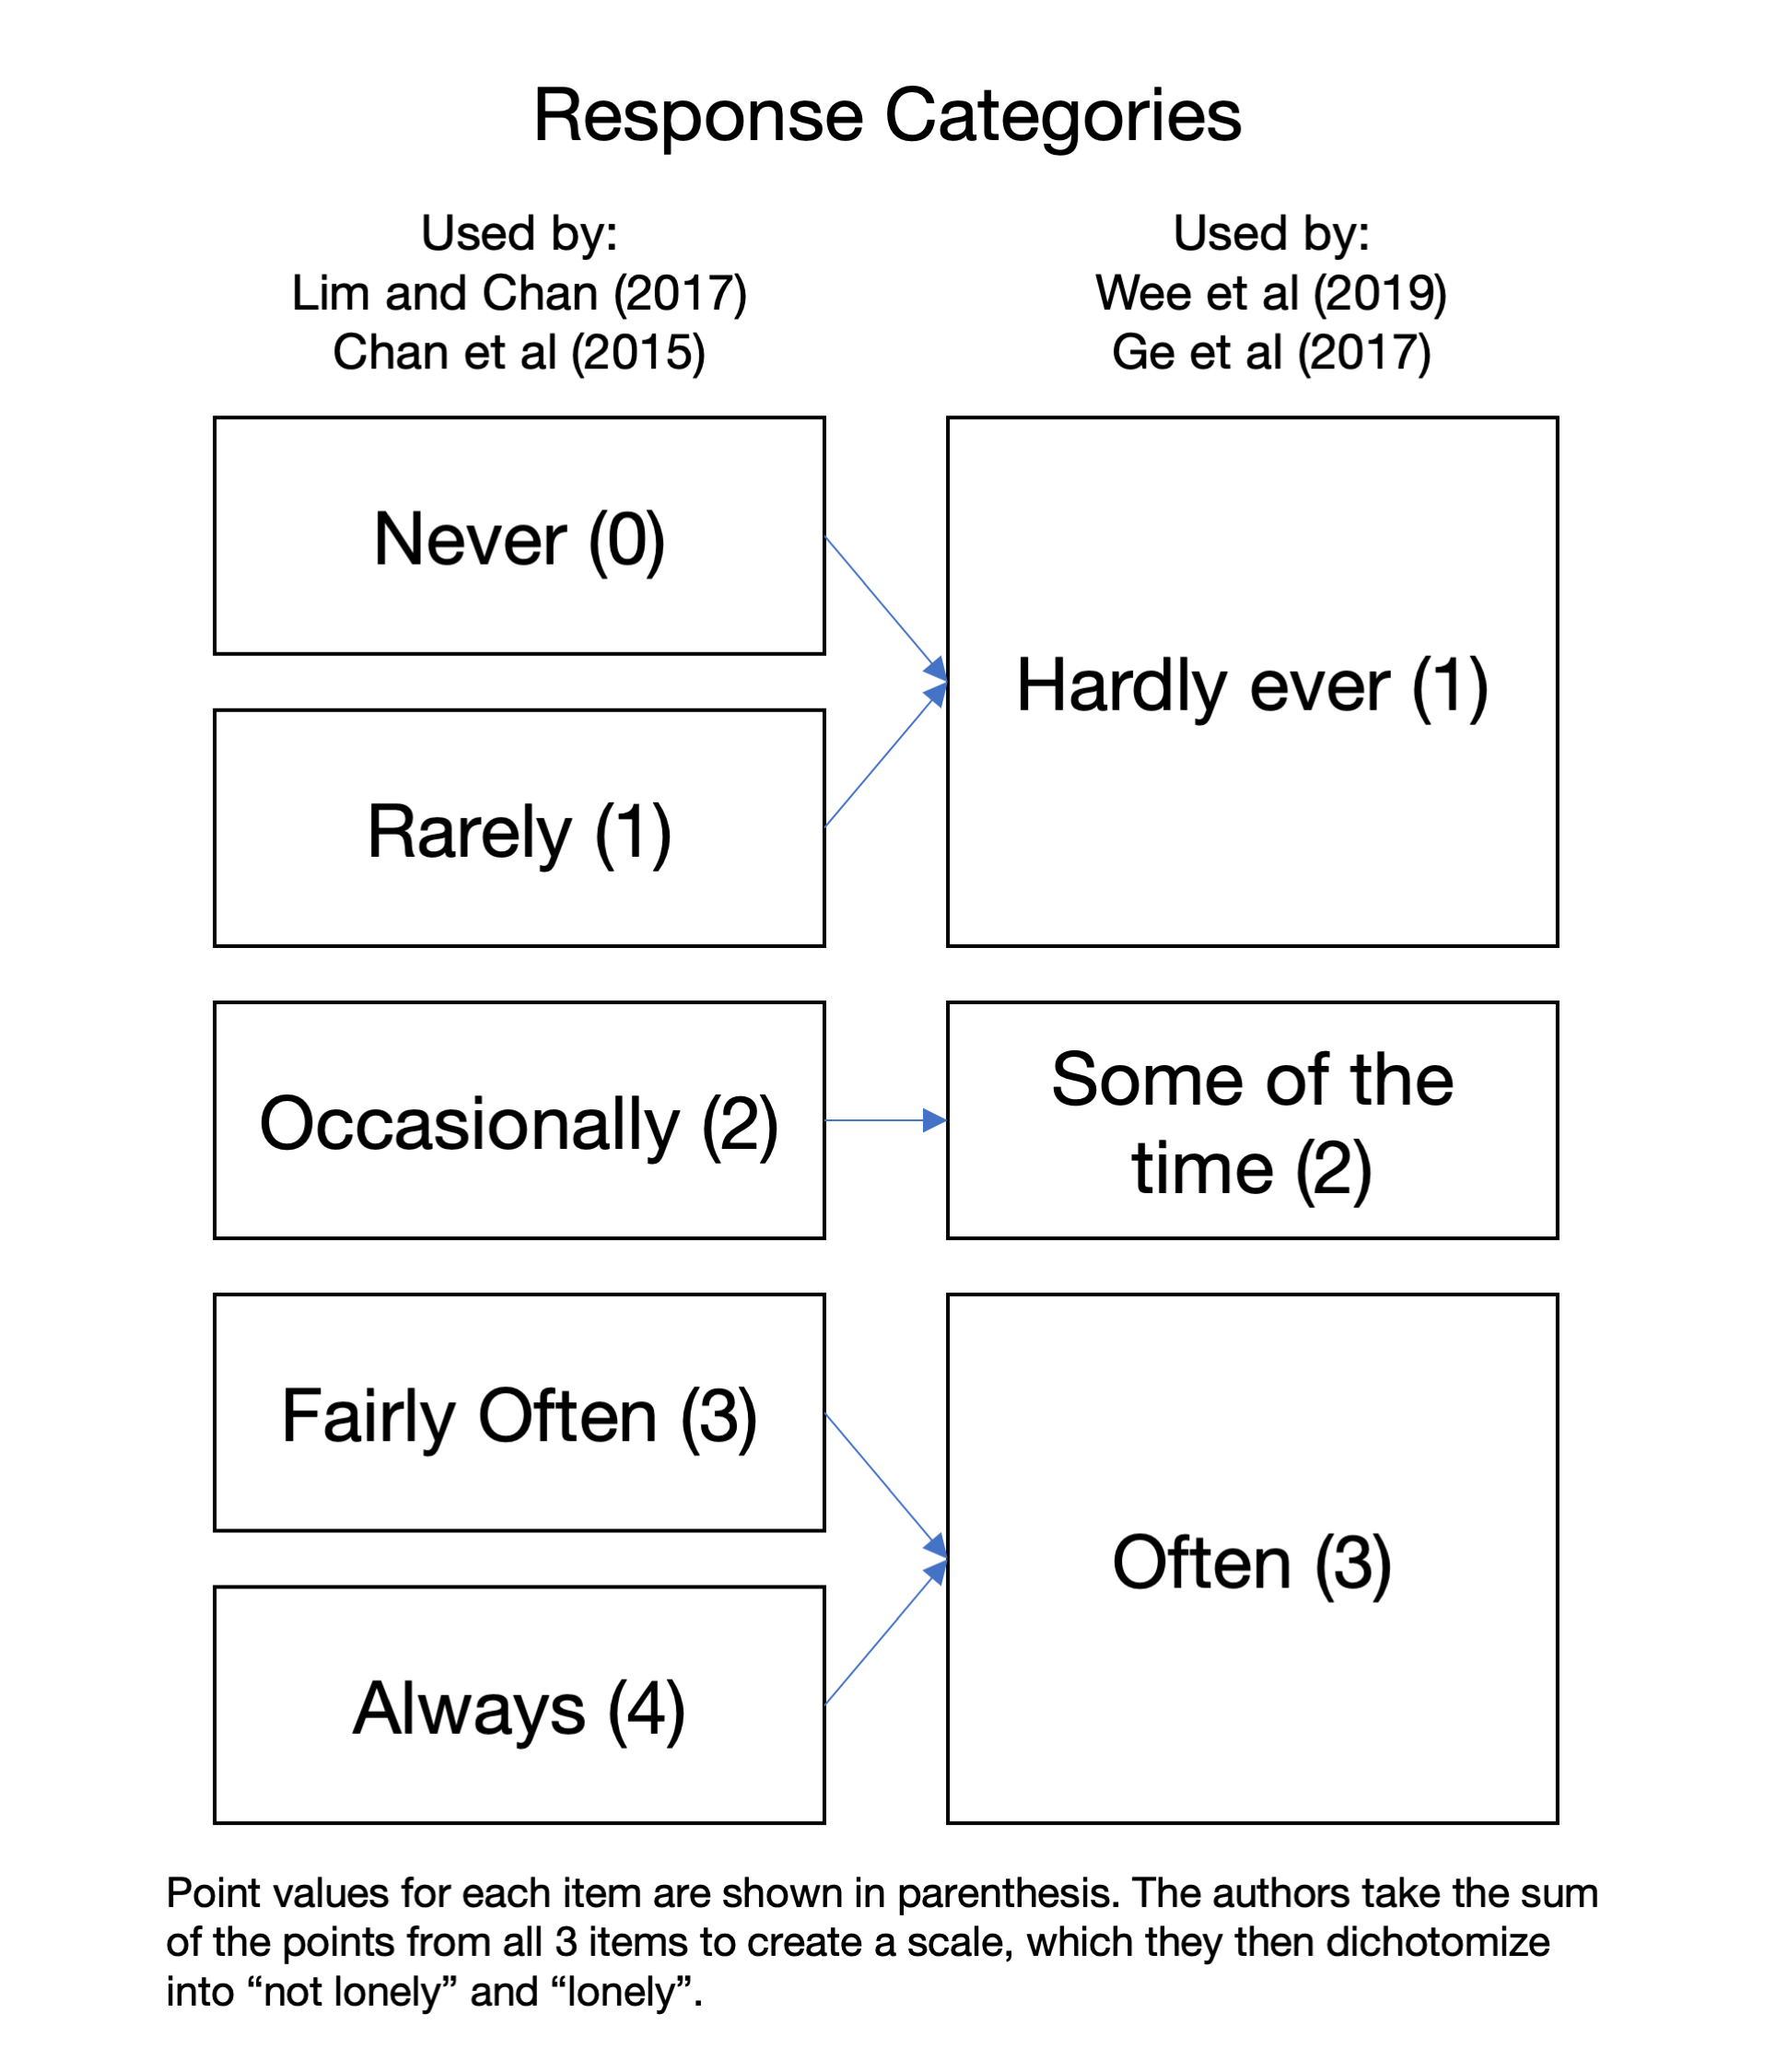
For each of the questions listed above, respondents were given a range of responses to choose from. These are listed in Figure 5.2. As you might notice, they were different across the studies. Wee et al. (2019) and Ge et al. (2017) had only 3 response categories (the right column), while Lim and Chan (2017) and Chan et al. (2015) had 5 different response categories (the left column). I put the point values for each response in parentheses. In all of these studies, researchers added up these points across the 3 questions, and came up with their own ‘cut-off’ point to determine who was “lonely”.

Figure 5.2: Summary of response categories
I added the blue arrows in Figure 5.2 to show how the 5 category option can be mapped to the 3 category option (but not vice versa). We don’t really know what kind of bias this will introduce26, but at face value I think this looks pretty reasonable. Why am I doing this? This “matching” allows us to do a little experiment with publicly available data27 to answer the following question: How does changing the criteria change our view of loneliness in Singapore? The next section compares these different coding schemes.
References
Chan, Angelique, Prassanna Raman, Stefan Ma, and Rahul Malhotra. 2015. “Loneliness and All-Cause Mortality in Community-Dwelling Elderly Singaporeans.” Demographic Research S15 (49): 1361–82. https://www.demographic-research.org/special/15/49/.
Hughes, Mary Elizabeth, Linda J. Waite, Louise C. Hawkley, and John T. Cacioppo. 2004. “A Short Scale for Measuring Loneliness in Large Surveys: Results from Two Population-Based Studies.” Research on Aging 26 (6): 655–72. https://doi.org/10.1177/0164027504268574.
Lim, Ka Keat, and Angelique Chan. 2017. “Association of Loneliness and Healthcare Utilization Among Older Adults in Singapore.” Geriatrics & Gerontology International 17 (11): 1789–98. https://doi.org/10.1111/ggi.12962.
Wee, E. Liang, Y. Tammy Tsang, Huso Yi, A. Sue Toh, L. Geok Lee, Jaime Yee, Shannon Lee, Kellynn Oen, and C. Gerald Koh. 2019. “Loneliness Amongst Low-Socioeconomic Status Elderly Singaporeans and Its Association with Perceptions of the Neighbourhood Environment.” International Journal of Environmental Research and Public Health 16 (6). https://doi.org/10.3390/ijerph16060967.