8.1 SDP vs. MOM
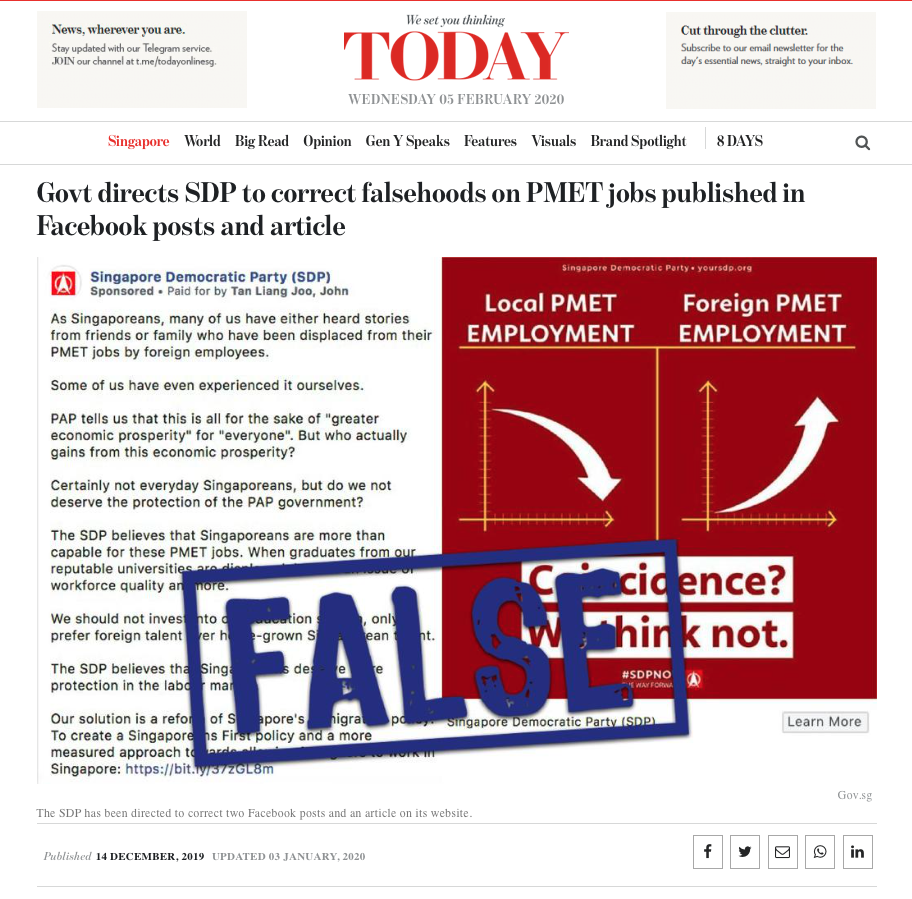
In an application of the Protection from Online Falsehoods and Manipulation Act (POFMA), sitting Minister for Manpower Josephine Teo issued three correction directions against the Singapore Democratic Party (SDP)72 for propagating online falsehoods. The SDP appealed against the order, and eventually lost in the High Court (see related news article).

Figure 8.1: Screenshot of online article on MOM’s correction directive. Retrieved February 5, 2020.
The point of this case study is not to say whose legal case was made out, which the court has already ruled on73. Rather, I will focus on one specific portion of the case, and highlight how we can ask better questions and demand better arguments from people who use statistics.
We will look at the first correction direction (CD-1), related to one of SDP’s earlier articles (found here). The point we will examine here is aptly described in the government’s Factually article74:
Falsehood #2 - The claim that Singaporean PMET retrenchment has been going up. The SDP website states that the party’s “proposal comes amidst a rising proportion of Singaporean PMETs getting retrenched”. This statement is false.
Fact #2a: There has been no rising trend of local retrenchments since 2015.
Fact #2b: There has been no rising trend of local PMET retrenchment since 2015. The number of retrenched local PMETs has declined from 6,460 in 2015 to 5,360 in 2018, the lowest since 2014.
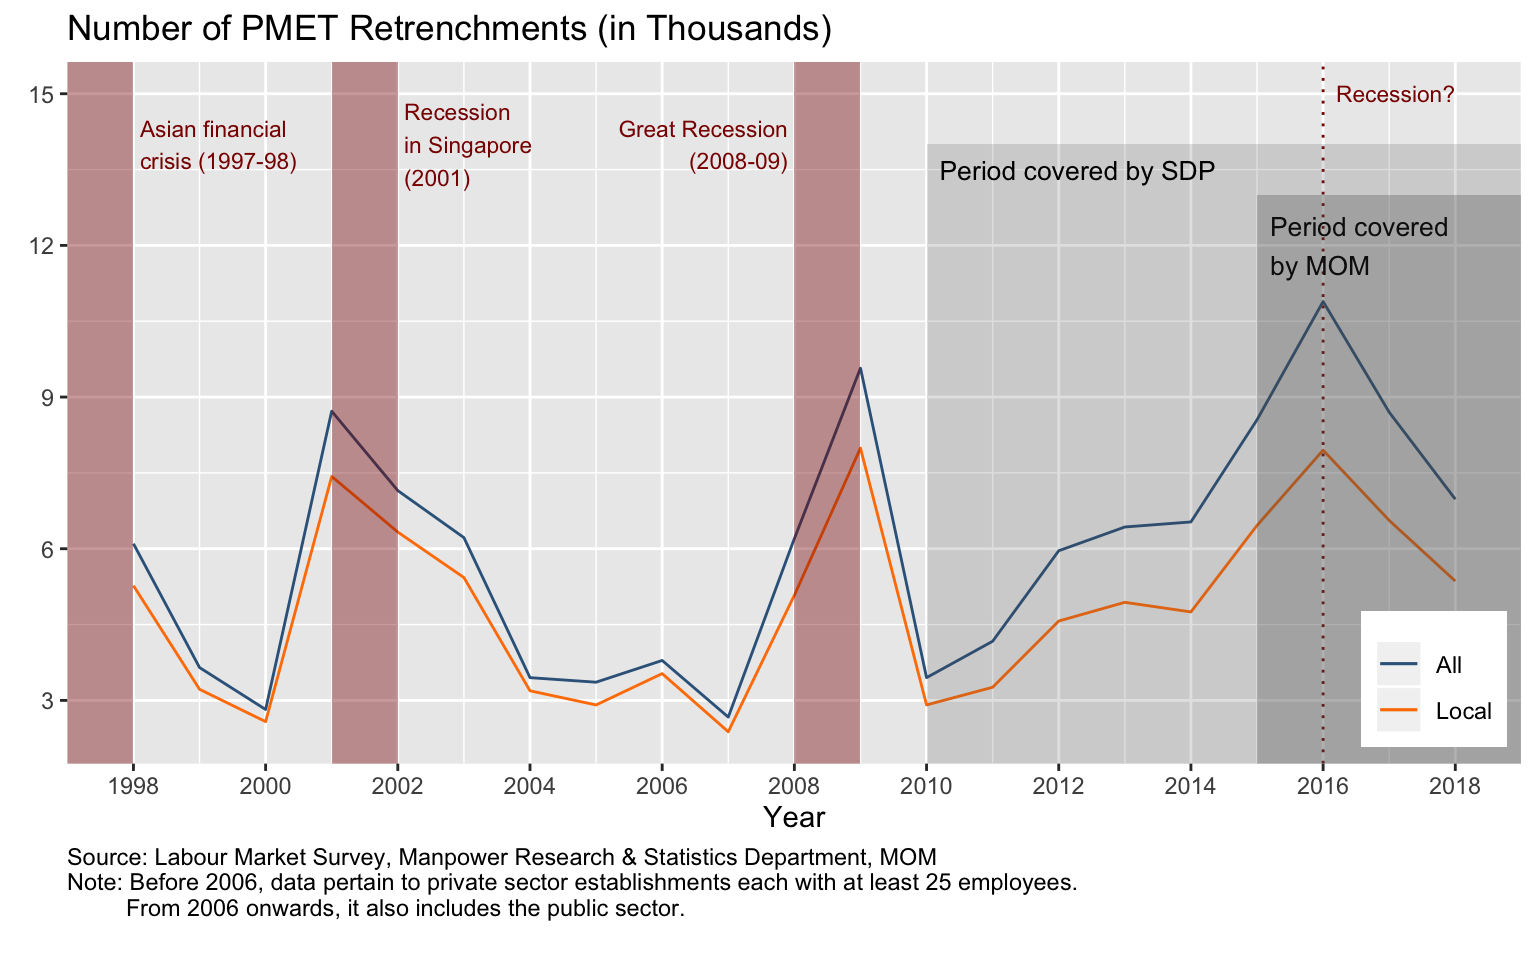
In response, the SDP provided their own take on the Ministry’s figures, and showed an overall increasing linear trend from 2010 to 2018. To bypass all this truncation of data, I decided to just plot all the data available. For numbers of all retrenchments (including locals and foreigners), you can find the figures I used from here. For numbers of local retrenchment, I got them by directly emailing the Manpower Research and Statistics Department at the Ministry of Manpower (MOM).

Figure 8.2: Chart of retrenchment rate over time
As we can see from the figure, there are vastly different trends depending on where you want to start from and how long of a trend you want to track. I have highlighted (in grey and dark grey) the portions that were used by SDP and MOM respectively. If you look across the whole figure, you will naturally find that in some parts of the graph the trend is increasing, and in other parts the trend is decreasing75. But does this mean that choosing a starting point from anywhere is arbitrary? Based on my reading of his judgement, Justice Ang Cheng Hock seems to suggest this:
Third, even if one takes the appellant’s [i.e., SDP] case at its highest and relies on the data from 2010 to 2018, it bears note that the appellant’s reference to 2010 as a starting point is somewhat arbitrary. Understandably, any timeframe may, to some extent, be criticised as being arbitrarily selected. However, the appellant’s own reasoning could warrant a starting point of 2009, or even 2008. Using 2009 as a starting point would show an overall decrease in unemployed local PMETs from 2009 to 2018, and this illustrates how using 2010 as a starting point is itself quite arbitrary.
Singapore Democratic Party v Attorney-General [2020] SGHC 25 in [96], emphasis mine
I would respectfully disagree with Justice Ang’s reasoning here76, if he is implying that any kind of starting point can be criticized as being equally arbitrary. In my view, it is possible to discriminate between worse and better time frames/trends to look at. I provide two reasons how this is so:
- The length of trends matter
Long-term trends and short-term trends may move in different directions, but parties should be expected to justify why looking at either type of trend is more relevant to the argument they are trying to make. This kind of justification should go beyond what the “reasonable person’s” default time frame is when reading an/any article, and look instead at exactly what sort of argument is being made (i.e., the topic at hand) to decide if long or short term trends are in view. While it may seem like people commonly have only “the most recent” trends in mind, there are instances when people naturally think about long term trends. It is easy to see why this is the case with some practical examples.
One relevant example would be investing in the stock market. Many investors (or financial advisors) use this adage: “It’s all about time in the market, not timing the market”. Essentially, what this suggests is that in the short term, the value of products such as exchange traded funds (ETFs) will fluctuate up or down, but in the long term (5-10+ years) it will generally appreciate. Go here and play around with the interface to see how trends of the Straits Times Index (STI) change depending on the time frame you pick. Most Singaporeans who have some form of financial literacy will understand this, and naturally think long-term trends when ETFs are talked about.

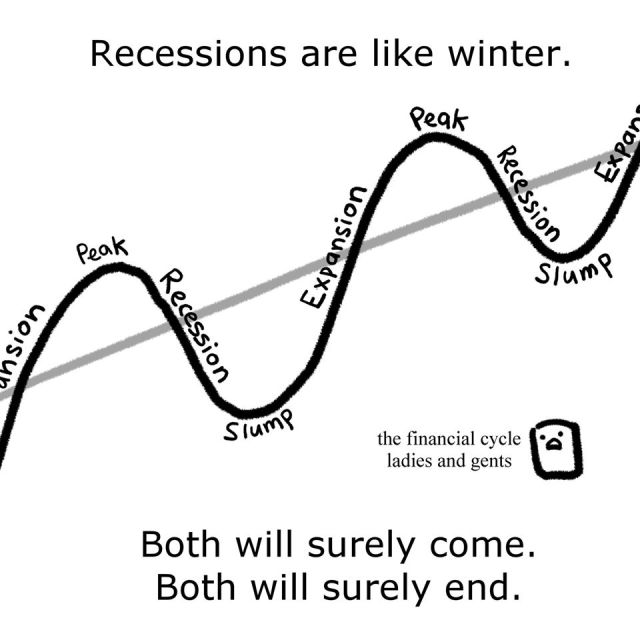
Figure 8.3: Source: https://thewokesalaryman.com
Another example is climate change. Scientists have pointed out again and again that tracking short-term trends in temperature cannot tell us much about long-term global climate change. In one article, the researchers note that we only start to see meaningful patterns when you look at 15-year averaged trends! Any argument made about climate change therefore needs to address long-term changes (e.g., how has the temperature changed in the past decade), not just short-term ones (e.g., how has the temperature changed from 2-3 years ago).
There are different benefits to thinking about long and short term trends. Long term trends are less susceptible to fluctuations due to random variation, and can provide a clearer picture of trends that short-term trends cannot detect (e.g., climate change). On the other hand, short term trends can alert us if something unusual is happening, e.g., a spike in flu-like symptoms may signal a virus spreading, or an increase in rural-urban migration rates in China may signal it is time for Chinese New Year.
My point, therefore, is this - there are good arguments to be made for whether a longer or shorter time-frame should be used. They are not equally arbitrary. Parties who are trying to make their arguments based on these choices (i.e., short or long term) should justify these choices, because it matters substantively.
- Not all start/end points are made equal:
Just as there are arguments to be made for longer or shorter trends, there are also arguments to be made for what are good “starting points” to use. In Figure 8.2 above, I highlighted in red the times when Singapore was facing a recession. As one would naturally conclude from the figure, there are spikes in retrenchment when a recession occurs. A “spike” here simply means that there is a rapid increase, and then a rapid decrease in the numbers, usually due to a exogenous (or endogenous) shock to the usual course of affairs77.
The question to ask is this - how meaningful is it to interpret (whether as a result of policy or not) the increase in retrenchments before a recession, or the decrease in retrenchments after a recession? I believe it would raise a red flag if someone decided to use data from 2007-2009 to show that retrenchments have increased, or to use data from 2009-2010 to show a decline. I requote from the judgement here:
Using 2009 as a starting point would show an overall decrease in unemployed local PMETs from 2009 to 2018, and this illustrates how using 2010 as a starting point is itself quite arbitrary.
Singapore Democratic Party v Attorney-General [2020] SGHC 25 in [96]
I would respectfully disagree with Justice Ang here. Using 2009 to illustrate the arbitrariness of using 2010 as a starting point is, in my view, not a fair comparison. This is because 2009 was the peak of the Great Recession in Singapore, and retrenchments are much more inclined to fall after a recession ends (somewhat of a “regression to the mean” phenomena). To say that retrenchment has decreased since 2009 effectively means that “we have fewer retrenchments now compared to during the Great Recession”, which is a little circular and doesn’t really tell us much. To say that retrenchment has increased from 2010, however, would mean that “we have more retrenchments now compared to since we first recovered from the Great Recession”. Various reasons could be given in both cases, but you should be able to see that there are meaningful (and not simply arbitrary) differences between starting from 2009 and 2010. This applies to other periods of recession as well. How we account for these ‘shocks’, and what meaning we ascribe to them, is important here.
So these are my two points again:
- The length of trends matter.
- Not all start/end points are made equal.
Something that I noted in the course of writing this article was the ‘mini-spike’ at 2016, which looks a little like the other recession spikes. I googled a little and found that there were some signs of an impending recession in that year (see, for instance, this article). The question that then came to my mind, given the considerations I’ve pointed out above, was this: how meaningful is it, then, to interpret the “most recent” 4-year trend provided by MOM? Why should we look at this trend instead of a longer term trend?
The court judgement seems to focus on one word when determining the appropriate time-frame - “amidst”. I was confused when I first read this, because the judgement suggests that the use of “amidst” is a reasonable basis to focus on a more recent time-frame (Singapore Democratic Party v Attorney-General [2020] SGHC 25 in [99]) contemporaneous to the release of the offending SDP article.
Perhaps there is a legal definition I am missing, but my own plain reading of amidst means something like “in the middle of” or “surrounded by” without any specific time-frame (long or short) attached to it. When used with trend data, I assume it means something like “co-occuring”, or “co-varying”. Both short-term trends and long-term trends can covary - e.g., if i say that “corporate greed has increased amidst globalization”, it is likely to refer to long-term trends covarying with each other. But can short-term situations covary with long-term trends? One example may be to say: “Greta Thunberg’s call to action comes amidst accelerating global climate change”. This suggests urgency and contemporaneity of the call to action, but intuitively refers not just to trends of short-term climate change but also long-term climate change (both short- and long-term trends reinforce each other). So perhaps SDP might have had a better case if they were able to show that their policies were explicitly made to address long-term trends, but this is just speculative.
I will categorically say that I take no sides in this case. What I am hoping for, however, is that when parties come together to use statistics to make arguments, they can do so with less heat and more light. News articles on this case reported that Deputy Attorney General Hri Kumar called SDP’s arguments “hopelessly flawed”, “disingenuous”, and a “blatant attempt to manipulate the available statistics in order to ignore the obvious downward trend in recent years and to artificially demonstrate an upward trend”. Despite the strong words being used here, the arguments of the Attorney General’s Chambers were highly unsatisfactory to me in terms of a concrete statistical justification (and for the record, so were the SDP’s arguments), for reasons I’ve highlighted above.
What, then, do I expect? In this particular case, I wished to see more of the following from both parties:
- Justification for why long or short term trends matter, especially with regard to retrenchment figures. Since what is in view is how policy affects the labor market - can we see short-term declines in retrenchment after a shock to the market (e.g., a recession) as a result of policy? How do we evaluate the effects of policy in the first place? Do we access them via long-term trends, or short term trends?
- Some explanation as to why we were seeing such trends - i.e., what are these increases/decreases driven by (e.g., composition of term contract/permanent employees)? How do recessions figure into the discussion and affect the way we interpret trends?
- More direct engagement to reduce confusion - As Justice Ang alludes to in Singapore Democratic Party v Attorney-General [2020] SGHC 25 in [80] and [92], if one party talks about proportions, the other should engage and provide relevant numbers for proportions, not make a separate argument using absolute numbers.
- More statistical rigour in general around topics like this. It’s one thing to look at a few numbers and argue whether the line has gone up or down. But it would be another if the MOM or the SDP could have statistically modelled, for instance, the probability that employers choose locals over foreigners, all else being equal (e.g., education, experience, etc.). This would directly address the allegations of locals being passed over for foreigners.
Ideally, POFMA is a law that pursues and protects truth. Justice Ang is worth quoting in full:
I pause here to highlight that both parties attempted to cast aspersions on each other’s intentions and motivations, with labels such as “disingenuous” and “dishonest” being bandied about. I underscore that the POFMA necessitates an objective approach based on the wording of the material in question. The issues are whether the subject statement(s) are borne out by the words and/or depictions in the communicated material, and then whether those subject statement(s) are true or false. The intentions of the parties in relation to the POFMA are thus, sensu stricto, irrelevant when there is no question before the Court of any criminal liability.
Singapore Democratic Party v Attorney-General [2020] SGHC 25 in [128]
In this spirit, my wish is for the court to consider the use of amicus curiae when dealing with issues requiring statistical expertise, especially when the determination of “true” and “false” is made somewhat on the interpretation of statistics. We now move on to a second example.
A local political opposition party.↩︎
Note that Minister for Law Shanmugam said the following in Parliament on 15 August 2016: “Academics or media outlets publish commentaries on a judge’s decision, even where an appeal is pending. These are not prohibited. Commenting on a judge’s reasoning is unlikely to pose a real risk of prejudicing the appeal outcome. We have not changed the law. Such commentaries are allowed today. If the Bill gets passed, they will continue to be allowed under the Act.”↩︎
Justice Ang Cheng Hock ultimately decided that the facts provided by Factually were not directly relevant to this proported falsehood, because it was not fair to interpret SDP’s statement on proportions as applying to absolute numbers (Singapore Democratic Party v Attorney-General [2020] SGHC 25 in [80] and [92]). He did, however, consider the arguments made on the grounds of absolute numbers, which we will also consider here.↩︎
You can also find that as the Factually article states, the proportion of local PMET retrenchments among all PMET retrenchments is decreasing.↩︎
Even though he qualifies these statements with “somewhat” and “to some extent”.↩︎
Our Ministers have been very consistent in pointing out that Singapore’s economy is highly dependent on the global economy, so assuming recessions are usually exogenous may not be too far off the mark↩︎