7.2 Declines in marriage and divorce
Marriage has been a key preoccupation of the Singapore government for many reasons (e.g., increasing fertility rates, shaping housing policy). Trends in marriage/divorce/fertility are thus often closely watched. The Straits Times recently published this article on marriage/divorce rates in 2018.
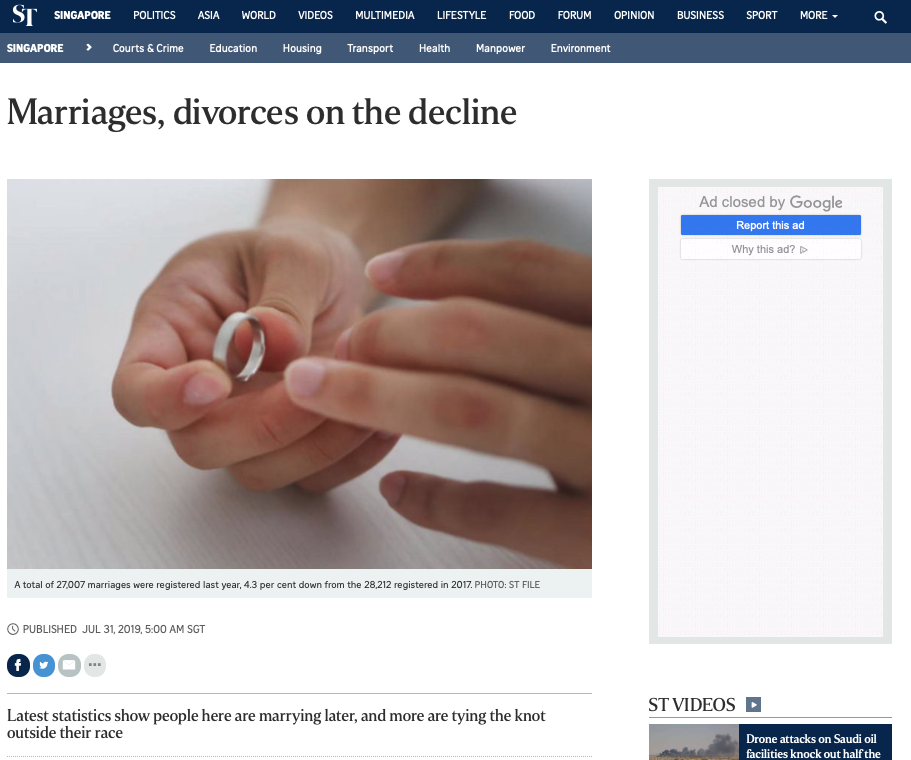
Figure 7.1: Screenshot of online article on marriage rates. Retrieved September 17, 2019.
The article is based on a report on Marriages and Divorces, produced by the Department of Statistics55. Among other things, the article states:
A total of 27,007 marriages were registered last year - the lowest in five years and 4.3 per cent fewer than the 28,212 marriages registered in 2017.
… Meanwhile, 7,344 marriages ended in a divorce or annulment last year, a 3.1 per cent drop from the 7,578 marital dissolutions in 2017.
… Given the volatile economy, observers said financial considerations could have contributed to the falling number of marriages and divorces last year.
Now, given that we’ve talked about age, cohort, and period changes, one question that should come to mind is: what kind of measure is this? Well, this is a period measure - it records the number of marriages in a certain year. Unnamed ‘observers’ cited by the article seem to understand this. They point out that the economy last year may have had a part to play, which is a plausible reason for period changes that suits the nature of the measure56. However, often times, people provide cohort explanations for changes in period measures.
The next two subsections will look at the question - How reasonable is it to adopt cohort explanations for changes in period measures of marriage?
7.2.1 Evaluating explanation 1
We first take a look at the following paragraph on changes in median age at first marriage:
The median age at first marriage for grooms rose from 29.8 years in 2008 to 30.2 years last year, while for brides, it went up from 27.3 years in 2008 to 28.5 years last year.
This is because more people spend a longer time getting an education and building up their careers before they settle down, said National University of Singapore sociologist Tan Ern Ser.
Note here that median age at marriage is, once again, a period measure - of all people who got married that year, half of them got married before age 28.5.
NUS sociologist Tan Ern Ser says that the median age at first marriage is rising because “people” spend more time in education and early-career building before they “settle down” (i.e., get married). But who are these “people”, exactly? Since most members of older cohorts do not usually go back into education and early-career building, there seems to be an implicit reference to younger cohorts (or, in layman terms, “people nowadays”)57.
How do we evaluate whether this explanation is reasonable? I advocate taking two steps:
- Figure out if trends observed reflect cohort change, rather than age or period change.
- Figure out if the explanation given for cohort change is supported by evidence.
Frustratingly, marriage statistics by cohort are not available from the government, so we cannot directly assess whether trends are really due to cohort change. The reason why period measures are used is often a matter of practicality (as we will discuss in the next section), but in other countries, academics use longitudinal panel survey data to estimate and project what might happen in younger cohorts. In Singapore, such survey data is scant and/or tend not to be shared with researchers outside of the government. This makes cohort change especially difficult to study. But we will work with what available data we can find.
Step 1
For a start, let us try to do Step 1 and make sure that changes in period measures are not due to the changing population age structure (i.e. age effects). Age-specific marriage rates are adjusted for the size of age groups and give us a picture of period change that is not driven by changes in age composition. They are thus very helpful here, and have been provided in the report on Marriages and Divorces by the Department of Statistics, where we find Figure 7.2.
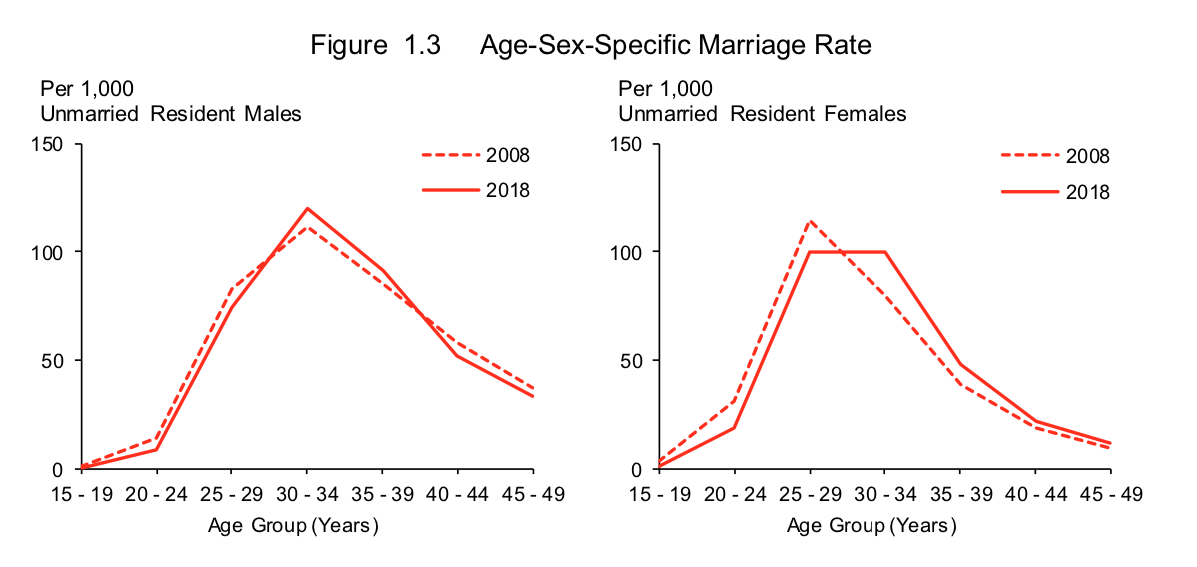
Figure 7.2: Screenshot from Department of Statistics report titled “Statistics on Marriages and Divorces, 2018”. Retrieved September 17, 2019.
You can see that the mountain-like shape in Figure 7.2 is moving to the right, telling us that in 2018, the marriage rate is lower among younger age groups (15-29) and higher among older age group (30+), compared to 2008. The figure thus suggests that people are getting married at later ages, and this is not just because our population as a whole is getting older. The combination of age and period data suggest that the presence of cohort change remains plausible (Step 1).
Step 2
Step 2 is to verify the cohort explanation itself. NUS sociologist Tan Ern Ser says that younger cohorts are delaying marriage in view of education and career building, so we should check that younger cohorts are indeed spending longer in education/early-career. The Ministry of Education happens to provide us data on Primary 1 cohorts (i.e., people who attended Primary 1 in the same year are in the same cohort), which tend to approximate birth cohorts closely (Figure 7.3).
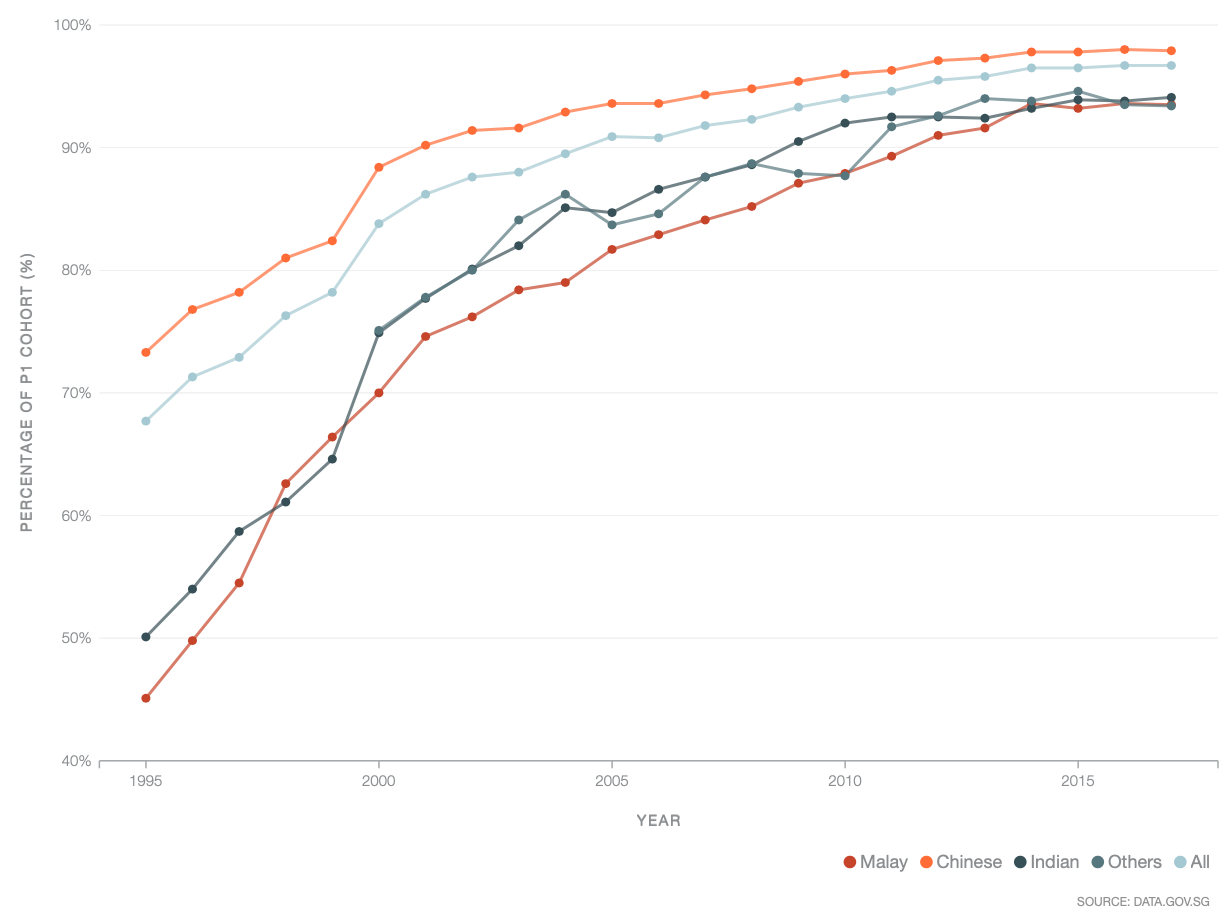
Figure 7.3: Screenshot from Data.gov.sg on “Percentage of P1 Cohort that Progressed to Post-Secondary Education”. Retrieved September 17, 2019.
The chart above shows that younger cohorts are indeed spending longer in education, since a larger percentage of them end up in post-secondary courses overall (see the rising trend across years). It does seem like younger cohorts are spending more time in education, so the cohort explanation therefore seems reasonable up to this point.
However, note that the report by the Department of Statistics states the following on page 7:
Between 2008 and 2018, the median age at first marriage among brides with secondary and below qualification rose considerably, narrowing the gap with graduate brides. For grooms, the differences in median age at first marriage across the educational groups also diminished over the same period.
This considerably undermines NUS sociologist Tan’s explanation that younger cohorts are delaying marriage in view of education and early career building, since it seems that even though younger cohorts are getting more education, median age of marriage is rising even among those without post-secondary education (and at a faster rate than those more highly educated). We have not considered the “early career building” part yet, but it shows that this explanation requires more work to validate.
7.2.2 Evaluating explanation 2
Let us now look at another comment that was made about marriage rates. The news article states:
…Singapore Management University professor of sociology (practice) Paulin Straughan said they also seem to be spending a longer time looking for the right partner. She said: “People believe that marriage is forever and unless they are very sure they have found a life partner, they wouldn’t marry.”
SMU Professor (Practice) Paulin Straughan surmises that median age at first marriage is rising because “people” wait to be very sure of their partner. While there may be some kernel of truth here (although no data is provided to support her point), it is quite unclear what she really means by this. Is she saying that everyone is delaying marriage because Singaporean culture has changed over time and people across all generations are now more careful about who to marry compared to the past58 (i.e., a period effect)? Or is she saying that younger cohorts are now more careful about who to marry (i.e. a cohort effect)?
Regardless, a natural follow-up question would be - does this also explain the reason why divorce rates are falling (as the news article headline states)? If the ‘waiting to be very sure’ explanation holds weight, it should follow that since people have become more careful to marry, marriages are probably less likely to end up in divorce59! People “waiting longer” also would then explain why divorce numbers are falling.
Suppose we adopt the following explanation: Divorce numbers are falling because younger cohorts are more careful (and therefore taking longer) about choosing their partners60.
Remember that the divorce numbers mentioned in the news article are a period measure61. Just like median age of marriage, the median age at divorce is also rising, according to the report by the Department of Statistics, which states on page 15:
With an ageing population and rising divorce rates for older persons, the proportion of divorcees aged 45 years & over rose from 32.7 per cent in 2008 to 44.0 per cent in 2018 for males, and from 21.7 per cent to 29.9 per cent for females. As a result, the median age at divorce rose over the last decade."
Also remember the 2 steps outlined in the previous sub-section:
- Figure out if trends observed reflect cohort change, rather than age or period change.
- Figure out if the explanation given for cohort change is supported by evidence.
Step 1
The quote above already hints at trends being driven by age composition (“ageing population”)62. This already tells us the government believes the period trend is unlikely to be driven by cohort change. However, we still can look at age-specific rates to replicate what we did earlier with marriage figures (Figure 7.4).
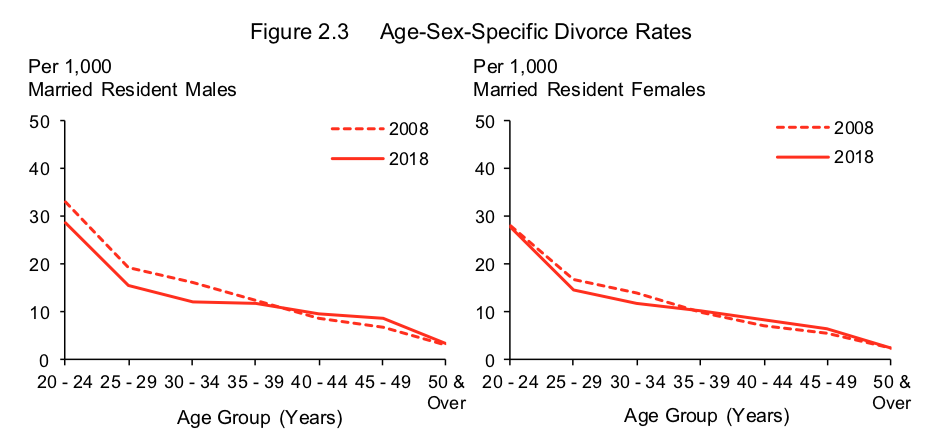
Figure 7.4: Screenshot from Department of Statistics report titled “Statistics on Marriages and Divorces, 2018”. Retrieved September 17, 2019.
Once again we see from Figure 7.4 that in 2018, divorce rates are lower among younger age groups (20-34) and higher in older age groups (35+), compared to 2008. This is the same situation as before (with marriage numbers), and there we temporarily concluded cohort change is possible, though not certain. So why does the Department of Statistics not connect period trends with cohort change?
Data on divorce trends by birth cohort are (again) not available, but all is not lost. Weirdly enough, there exists some information on divorce by “marriage cohorts” (where each cohort is defined by the year they got married - i.e., if you got married in the same year as I did, you are in my marriage cohort) in a report by the Ministry of Social and Family Development (found here). What kind of change marriage cohort trends really capture is quite hard to say, but for heuristic purposes we may assume they (very) roughly approximate63 birth cohort trends. Figure 7.5 shows us the proportion of divorces (y-axis) that happen before the couples’ \(x^{th}\) anniversary (shown on the x-axis), by marriage cohort (indicated by the color and shape of the lines).
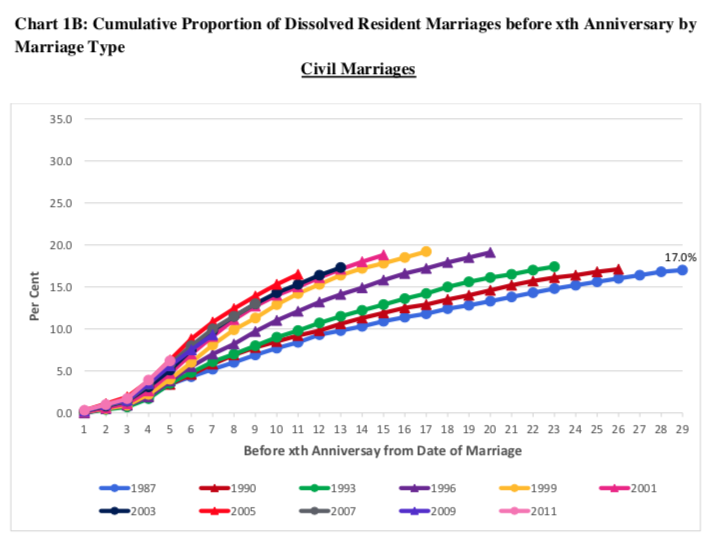
Figure 7.5: Screenshot from Ministry of Social and Family Developent report titled “Dissolutions of Marriages Among Marriage Cohorts, 1987-2015”. Retrieved September 17, 2019.
What can be observed from Figure 7.5 is that younger (marriage) cohorts seem to be getting divorced earlier64. For instance, you may notice that a higher proportion of those married in 2011 (light pink line) dissolve their unions before their 5th anniversary compared to those married in 2001 (dark pink line) or earlier65.
The picture painted here seems more bleak66 compared to what we expected from period trends (and the news article). While period trends seemed to suggest that people were getting more careful with partner selection (since divorce rates were falling overall and median age of marriage and divorce has increased), cohort trends seem to be telling the opposite story - younger cohorts seem to be getting divorced earlier into their marriages!
Step 2
The cohort explanation we adopted for this section was that “Divorce numbers are falling because younger cohorts are more careful about choosing their partners”. We have already found, however, younger cohorts (albeit marriage cohorts, not birth cohorts) are in fact getting divorced earlier. This directly contradicts the cohort-based explanation.
What is key here is to note that while period measures and cohort measures can sometimes tell similar stories about societal change, there are many times when they do not. When we say “marriages and divorces are falling”, we need to be clear what the data allows us to say, and what kinds of explanations we give. If cohort trends are not the same as period trends, than providing cohort explanations for period change becomes meaningless.
We must therefore be very careful how we make claims about societal change, and what data we use to back it up. In the next section, we will look at life expectancy - a highly misunderstood measure in popular discourse.
We will focus on discussing non-Muslim marriages here, but the same principles can be applied to Muslim marriages as well.↩︎
The general marriage rate, which is adjusted for population size of unmarried residents aged 15-49, also seems to tell this story.↩︎
Of course, there is now a great drive towards lifelong learning and mid-career switches, but in the context I think it is reasonable to assume this is not the group of people being referred to.↩︎
Think about what this really means though. How possible is it to observe this?↩︎
It could also be that even though people are more careful, they still make choices that end up in divorce, but this is somewhat an awkward assumption to make given a plain reading of the comment.↩︎
This is not what SMU Professor (Practice) Paulin Straughan explicitly said, but something that we have inferred for heuristic purposes, after making several assumptions about carefulness in partner choice and stability of marriages.↩︎
You may also ask, since we’re dealing with absolute numbers, isn’t it obvious that if there are less marriages, then there would be less divorces too? This is why absolute numbers are seldom helpful when examining societal change. At a minimum, we should attempt to look for rates that are adjusted for the size of the group at risk.↩︎
For those more technically oriented, Martin (2009) and Luo and Hodges (2020) have intriguing discussions about age*period interactions as cohort effects.↩︎
Think about who gets married in a certain year. What kind of people are they composed of? What characteristics do they share? It is hard to say. Other than sharing the same year of marriage, diversity within marriage cohorts is likely to be huge. We can only assume that younger birth cohorts will dominate most of the marriages in later years, but it remains to be seen whether this is accurate.↩︎
It remains to be seen if lifetime divorce rates will be higher, since we cannot yet observe the full trajectory of union dissolutions for the younger cohorts (or even for older cohorts, since not all of them have disolved their union or passed away).↩︎
Note that this does not really line up with the 2018 and 2008 measures we were comparing before, but there really is no easy way to do this.↩︎
Assuming divorce is always a bad thing, which may not always be the case. A rise in divorce rates may possibly reflect changes in power dynamics within couples, with women becoming more independent and more willing to leave abusive situations.↩︎